Application Performance
Monitoring Tool
With Progress® WhatsUp® Gold application performance monitoring software, get instant alerts, pinpoint root causes and quickly restore application performance.
Video
Application Performance Monitoring Overview
Proactively Monitor App Performance
Get alerts when problems occur, quickly identify the root cause, and restore application performance levels to support your business, meet your users' expectations and comply with Service Level Agreements (SLAs) with the Application Performance Monitoring Tool

Application Performance Monitoring
WhatsUp Gold application performance monitoring software provides you with an array of monitoring profiles for popular apps. Leverage these out-of-the-box, best-practice profiles, customize them or create your own to get real-time monitoring for all your mission-critical applications.
Meaningful Alerts
You get fine control over which conditions generate alerts. You can set separate warning and down states, define critical and non-critical application components and even define component or application-level dependencies.
Reports and Dashboards
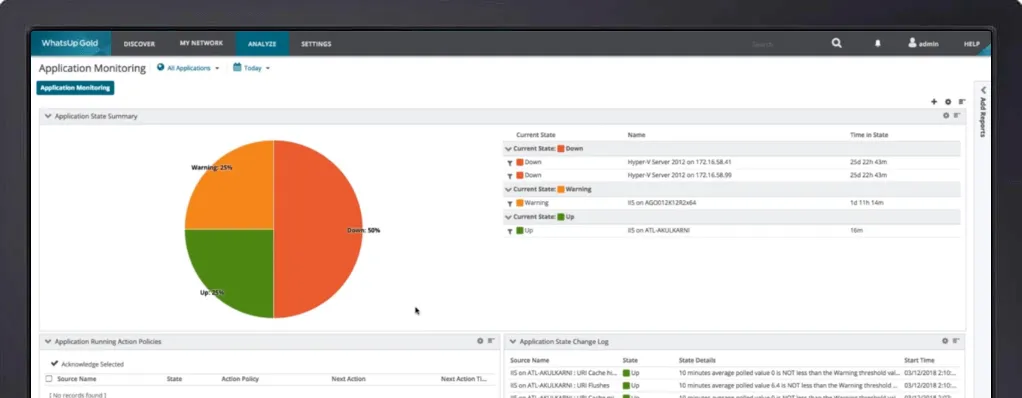
Get quick visibility to the health of all applications with the Current Status Dashboard. Analyze application performance problems over time or diagnose chronic problems with our Component Summary Dashboard.
Stay Ahead with Application Performance Monitoring Software
Monitor Commercial Applications
Use out-of-the-box monitoring profiles to get continuous updates on the availability and performance of mission-critical applications like Exchange, SharePoint®, Dynamics, Lync®, SQL Server®, DNS, Internet Information Services (IIS), Active Directory®, Hyper-V® and more.
Monitor In-House Applications
Quickly generate custom application profiles with an intuitive profile development utility. The WhatsUp Gold monitoring solution discovers the target server's services and processes. Our MIB browser and WMI library provide access to thousands of SNMP objects and Windows® performance metrics.
Get Accurate Alerts
Get alerts on component and application-level dependencies. Define multiple application states for alerts such as up, warning, down, maintenance and unknown. Configure blackout policies for alerts and actions such as suspending alerting on weekdays between 9 p.m. and 6 a.m.
Define Automated Recovery Actions
Create multi-step Action Policies that fire on a state change such as one that, on down state, immediately writes a log entry, kicks off an action script to reboot the system five minutes later and sends an email notification ten minutes later.
Action Policies and Alerting
When a monitored component or application changes its state, you can create multi-step Action Policies. Action Policies can include issuing alerts via text or email, capturing events to a log file, or self-healing actions such as re-starting an application service or initiating a PowerShell script. For example, when an application goes into a down state, you can specify an action path that writes a log entry, triggers an action script to reboot the system, and sends an email notification.
You can define attributes to easily keep track of important configuration and settings information about your applications and systems. Take advantage of powerful percent variables in your action policies and component configurations, such as passing key information about your applications in email alert notification.
Application Performance Reporting Tools
Leverage an Application Performance Monitoring Dashboard designed to help quickly identify the root cause of problems and identify trends that can affect future performance.
- Assess the health of all applications with the Current Status Dashboard, then select an application for drill-down analysis.
- Leverage Historical Status Reports to drill down and analyze application performance problems over a period of time and identify difficult-to-diagnose, intermittent performance problems such as memory leaks and URI cache failures.
- Report chronic problems with our Component Summary Dashboard that details all monitored components for an application, including the percentage of time spent in different states.
- The State Change Log keeps a running tally of all state changes at the application and component level to anticipate potential problems.
Download the Application Performance Monitor Data Sheet
FAQ
What is Application Performance Monitoring (APM)?
Application Performance Monitoring (APM) is a set of tools and practices designed to help optimize software application performance. It assists developers, IT operations and business stakeholders in monitoring, analyzing and improving the performance and availability of applications.
How does Application Monitoring work?
Application monitoring works by observing an application’s behavior in real time. It collects data like how fast it responds, how often it crashes and how much system resources it uses. This data is then analyzed to spot problems or slowdowns. If something goes wrong, the system sends alerts so developers or IT teams can fix it quickly.
What is the difference between Application Performance Monitoring and Application Performance Management?
While APM focuses on collecting and analyzing data regarding an application’s performance, Application Performance Management goes a step further by not only monitoring but also actively managing and improving the application's performance through strategies, optimizations and decision-making. In essence, monitoring is about collecting data, while management is about using that data to act and maintain the application’s efficiency and reliability.
WhatsUp Gold Licensing
Flexible licensing options to suit your organization's needs.
Delivers real-time visibility into device health, application performance, and traffic flows so IT teams can ensure uptime, optimize capacity and help prevent service disruptions. Helps reduce operational costs, accelerate troubleshooting and maintain a consistent user experience.
Business
starting from
Enterprise
starting from
Enterprise Plus
starting from
Premium
starting from
Total Plus
starting from
Get Started
Complete the form to download your free trial of WhatsUp Gold.

