WhatsUp Gold
Simplify the Management of Your Complex IT Infrastructure
Quickly identify and resolve issues in your hybrid cloud through intuitive workflows, system integrations, and unmatched out-of-the-box functionality.
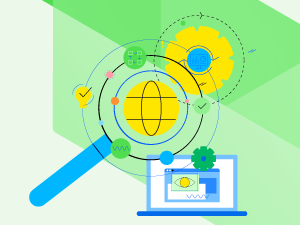
Network Availability and Performance Monitoring
WhatsUp Gold provides complete visibility into the status and performance of applications, network devices and servers in the cloud or on-premises.
_leader_mid-market_leader.png?sfvrsn=b32c019b_1)
_highperformer_small-business_highperformer.png?sfvrsn=5479180_1)
_highperformer_mid-market_highperformer.png?sfvrsn=862bd93c_1)
_highestuseradoption_mid-market_adoption.png?sfvrsn=380cfda0_1)

WhatsUp Gold Earns High Marks in Latest G2 Report
WhatsUp Gold has been recognized as an industry leader in the recent G2 Grid Report for network monitoring solutions winning 17 total awards overall.
Read Report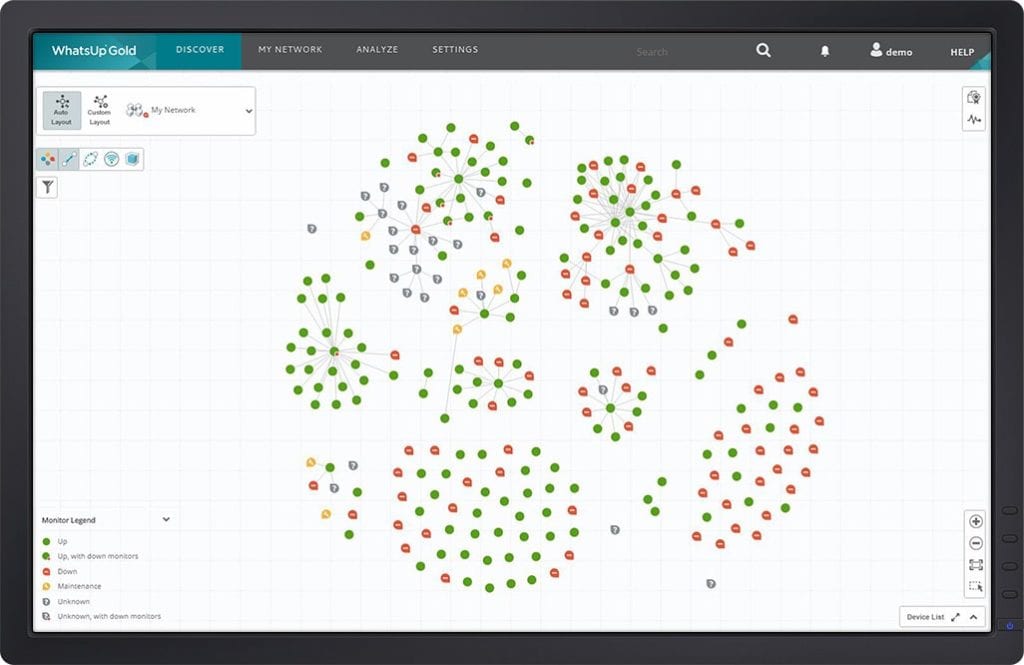
Discover Your Network
WhatsUp Gold’s powerful layer 2/3 discovery results in a detailed interactive map of your entire networked infrastructure. Monitor and map everything from the edge to the cloud including devices, wireless controllers, servers, virtual machines, applications, traffic flows and configurations across Windows, LAMP and Java environments.
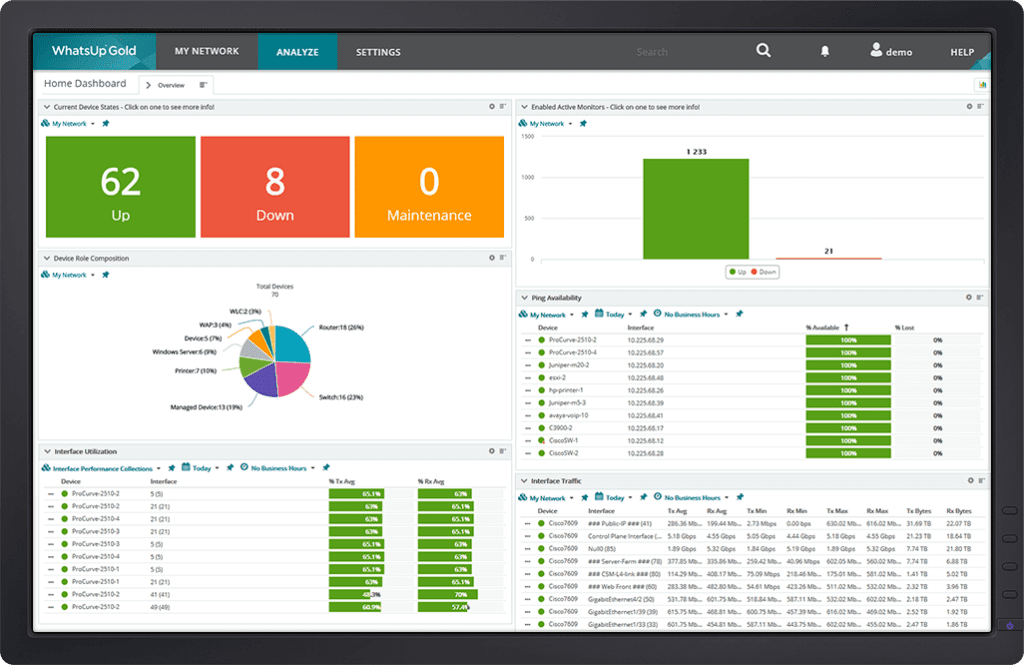
Get Real-time Alerts
Ensure optimal performance and availability to meet or beat SLAs. Manage networks, traffic, physical servers, VMs and applications with easy-to-use and customizable maps, dashboards and alerts. Click on any device in WhatsUp Gold to get immediate access to a wealth of related network monitoring settings and reports.
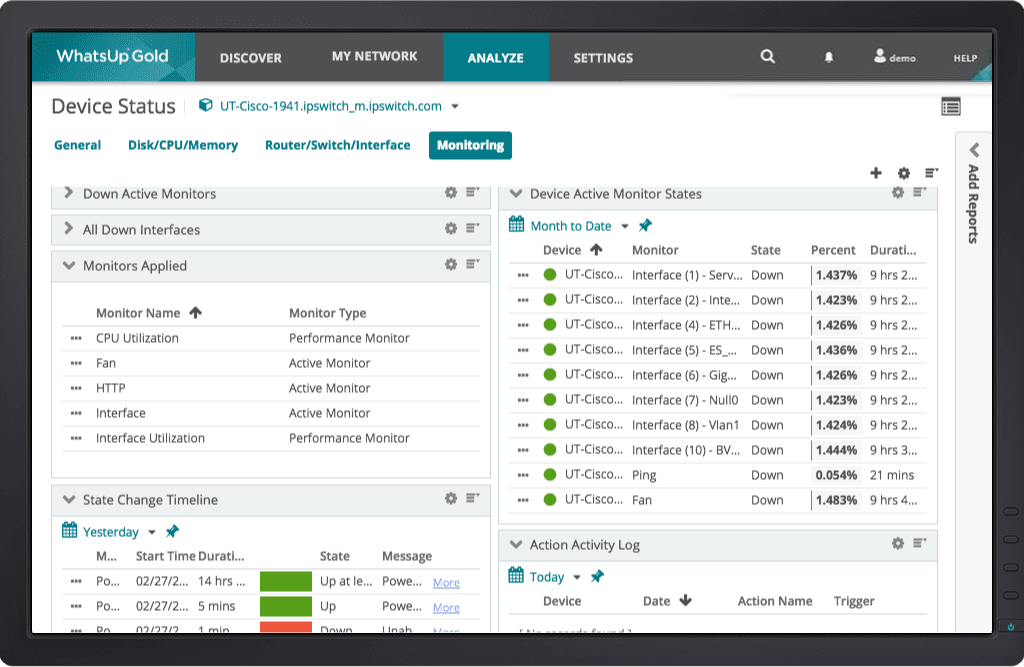
Resolve Issues Quickly
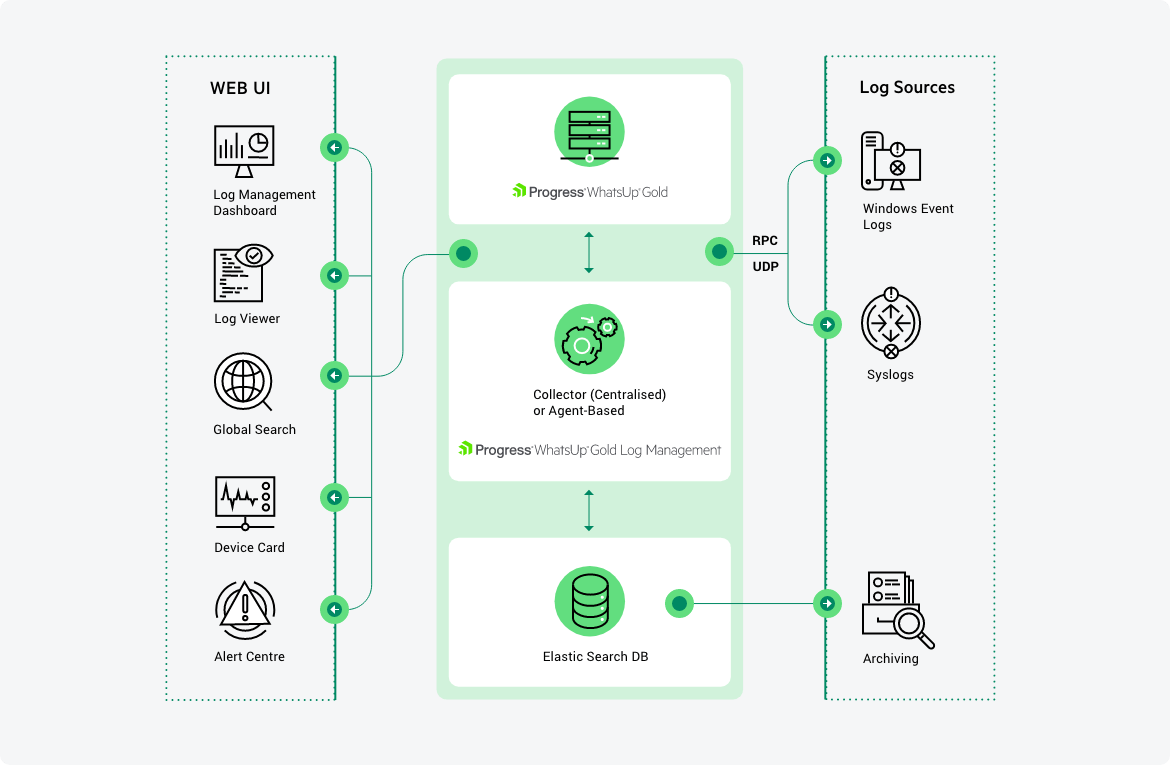
Simple, Integrated Log Management & Archiving
WhatsUp Gold Log Management provides easy visibility and management of device log data – all integrated into an easy-to-use, industry-leading interface. You can monitor, filter, search and alert on syslogs or Windows logs for every device in your network while also watching for meta trends like log volume changes. You can archive logs to any storage locations for any retention period to comply with regulatory requirements and preserve historical data.
Integrate with Flowmon NPMD/NDR
Display data from Flowmon’s advanced network performance and traffic analysis solution, including network security detection and response capabilities. Extend network observability via Flowmon from within the same WhatsUp Gold interface.
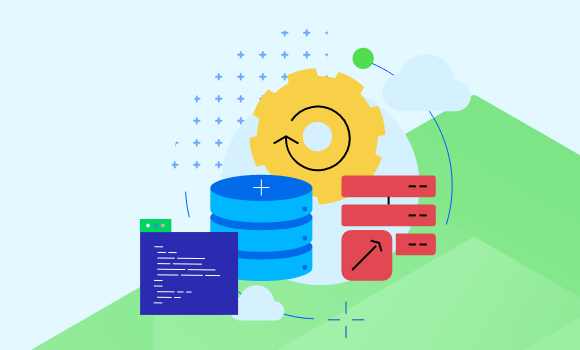
Learn moreIntegrate and Automate with REST API
The new WhatsUp Gold REST API offers a powerful suite of calls that let you integrate network monitoring data with other systems and also let you automate a broad range of network monitoring tasks such as adding and removing devices.
Learn moreWhat Can You Monitor with WhatsUp Gold?
Application Performance
Easily monitor the performance of Linux systems, Apache web servers and Microsoft applications.
Monitor ApplicationsBandwidth Consumption
Analyze bandwidth consumption across networks, servers, applications and more.
Monitor BandwidthCloud-based Resources
WhatsUp Gold gives you comprehensive visibility and control of AWS and Azure cloud environments
Monitor the CloudNetwork Performance
WhatsUp Gold helps you find and fix problems before your users are impacted.
Monitor Network PerformanceHyper-V and VMware
Get powerful visibility to physical, Hyper-V and VMware environments.
Monitor Virtual EnvironmentsWireless Networks
WhatsUp Gold can visualize and assure the performance of your wireless networks.
Monitor Wireless NetworksWhatsUp Gold Add-On Modules
These add-on modules integrate seamlessly with WhatsUp Gold to extend it’s core capabilities.
Network Traffic Analysis
Network Traffic Analysis delivers detailed and actionable data on network traffic and bandwidth consumption. The WhatsUp Gold NTA module not only monitors overall bandwidth utilization, but also indicates which users, applications, and protocols are consuming the most bandwidth. It supports a wide variety of flow protocols including NetFlow, NSEL, QUIC, sFlow, J-Flow and IPFIX.
Application Performance Monitoring
The APM module extends the visibility of WhatsUp Gold to monitor the performance of mission-critical applications like Exchange, SQL Server®, SharePoint®, Dynamics, DNS, IIS, Active Directory®, Hyper-V® and more. Customize definitions of application states and how SLAs are calculated to eliminate false SLA failures.
Log Management
WhatsUp Gold Log Management brings device log information to your fingertips. You can gather Windows event logs & syslogs, control and/or visualize them from the map or customizable dashboards and trigger alerts on specified conditions. Configure log searches and export the results automatically or on demand. Archive logs for regulatory compliance or to preserve historic data. Simplify your life when logs become part of your network issue diagnosis process.
Configuration Management
WhatsUp Gold’s Network Configuration Management module automates the configuration and change management for routers, switches and firewalls on your network. Archive and audit network configurations and get alerted to configuration changes. Reduce errors and support compliance requirements for HIPAA, SOX, FISMA and PCI DSS and other regulations.
Virtualization Monitoring
Virtualization Monitoring is an add-on module that adds the capability to discover, map, monitor, alert and report on both small virtual environments and entire data centers.
Failover Manager
WhatsUp Gold Failover Manager automatically switches from a primary instance of WhatsUp Gold to a backup system if the primary instance fails. Users can customize the criteria that determine a failed state — such as if all services are down, or if only specific services fail. Contact our team to learn more about Failover Manager.