
One of the biggest headaches for IT is dealing with intermittent network performance problems. These are the kinds of issues that boldly appear but soon vanish before the source can be pinpointed. Only to happen again and again, frustrating and random each time. In most cases, these network performance problems look like they could be rooted in a certain area when, in fact, they lie somewhere completely different.
To demonstrate this in a real-world type scenario, let's visit Bob the sysadmin.
Bob the Sysadmin Has a Wireless Issue
Bob’s users are experiencing network performance problems in the form of slow Wi-Fi. He and his fellow members of the IT team determine that the problem was connected to a wireless access point located near a large conference room. Upon reviewing historical graphs displaying clients, bandwidth usage and resource utilization, his team concluded there was enough wireless capacity.
Bob then turned his attention to wireless signal strength and analyzed historical SNR (signal-to-noise ratio) graphs. This exposed several noticeable patterns:
- The problem started two weeks prior
- SNR degraded almost daily between 11:30am and 1:30pm
- The degradation occurred over 1-to-2 minute intervals
- The issue had no discernible pattern
Using the correlation between views in WhatsUp Gold 2017, Bob identified root cause of the network performance problems: noise generated from an old microwave oven in a nearby employee kitchen.
Come to find out, even legacy systems like kitchen appliances can affect network performance.
Pinpointing Network Performance Problems with WhatsUp Gold 2017
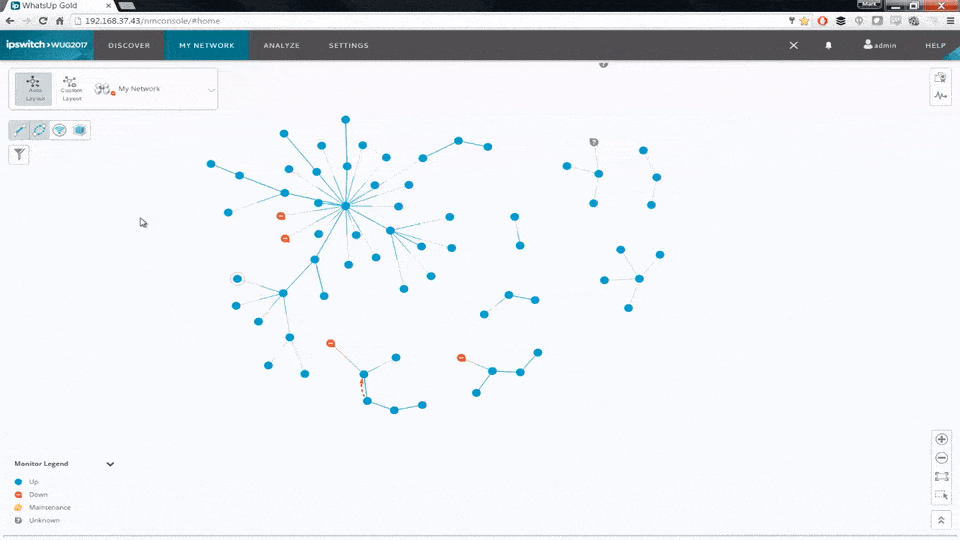
When an end user complains about wireless performance, the wireless network map produced by WhatsUp Gold 2017 can help you follow the connection between the client, access points and wireless LAN controllers (WLCs). You can also see all the other clients connected to the same access point, possibly indicating an oversubscription problem.
“The new map has an organic feel – you almost think it's alive as it discovers your network."
Tim Walsh, Senior IT Architect
The first question you should ask when network performance problems arise is: “Do I have an access point capacity problem?”.
Historical data in WhatsUp Gold 2017 is collected and presented in a way that exposes patterns in client count and bandwidth usage. This allows you to correlate graphs to the time when network performance problems were first reported. By analyzing patterns in the number of clients connected to an access point, and the corresponding bandwidth usage, you can then determine if the access point can handle wireless volumes at peak usage.
“It’s easy to add on to the dashboards in WhatsUp Gold 2017. The new design for device status, devices properties and adding new monitors is very easy to use.”
Ana-Maria Martisca, treeConsult
If you are satisfied with the wireless capacity your users have – but they aren’t – you may want to ask yourself if you have a signal strength problem.
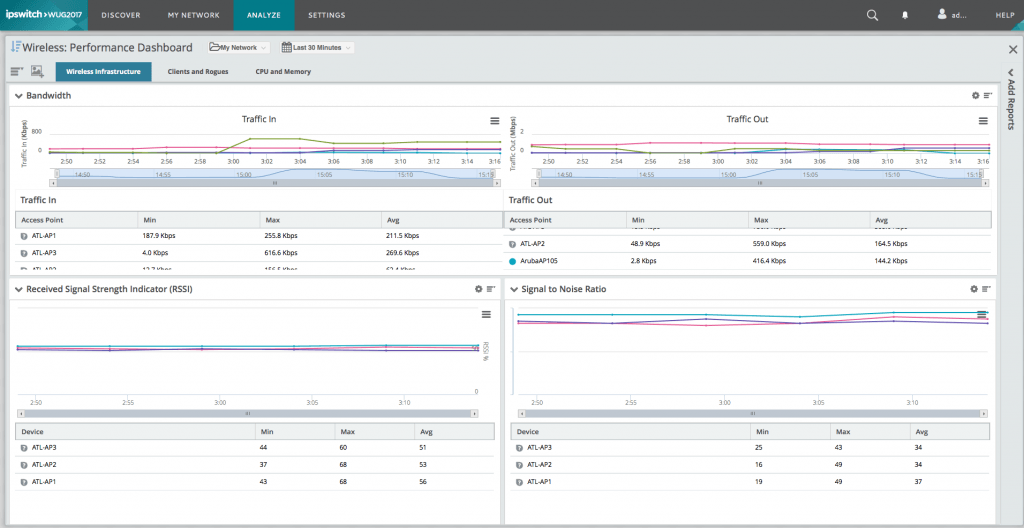
Taking a look at historical data in WhatsUp Gold 2017 that shows signal-to-noise ratio and received signal strength indicator (RSSI) will expose patterns of excessive noise that interferes with the wireless signal.
This is just a peek into the much broader capabilities WhatsUp Gold 2017 has to offer. If you like what you see, download a free 30-day trial of WhatsUp Gold 2017 today.