
Zoom has seen an explosion in popularity as of late, due in no small part to the global pandemic and the resulting mass shift towards work-from-home policies that have pushed thousands of meetings online every day. Now more than ever, many businesses depend on reliable access to Zoom, and there is a need to know as soon as possible about any issues with accessing Zoom. In this article, we'll show you how you can use WhatsUp Gold to monitor Zoom.
What is WhatsUp Gold?
WhatsUp Gold is a complete network monitoring solution that allows you to monitor your critical systems, both on-premise and in the cloud. WhatsUp Gold is highly customizable and as well as very flexible. With WhatsUp Gold, not only can we monitor the status of Zoom but we can also monitor the availability of your network infrastructure, server infrastructure, storage infrastructure, and much more.
How do I Monitor Zoom— It’s in The Cloud?
WhatsUp Gold allows you to monitor anything that we can populate data about. It does not matter if that data is from on-premise systems like your routers, switches, and servers or cloud environment such as AWS, Azure, or Meraki as well as SaaS (Software as a Service) solutions such as Zoom, WebEx, or Office 365.
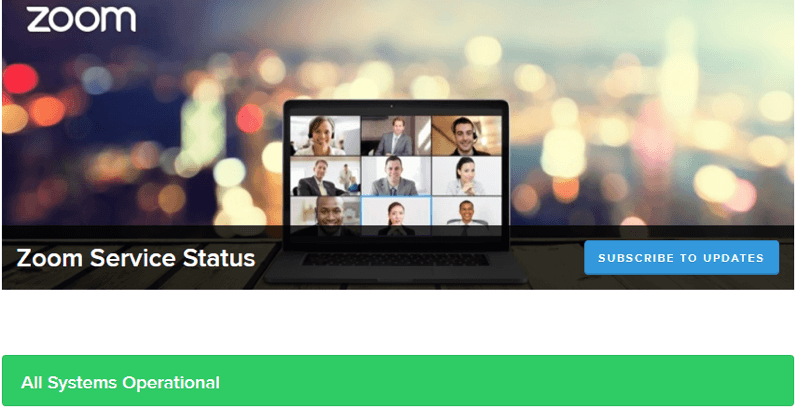
That being said, you will more than likely always have multiple solutions to choose from when solving for “How do I monitor this?” For Zoom, I would suggest using their status page (https://status.zoom.us/) and reading the relevant data. If you’re not familiar with creating custom monitors in WhatsUp Gold, that’s okay. I am going to walk you through it step-by-step.
Create the Monitor
The first step is creating the monitor. I am going to go to Settings > Libraries > Monitors.

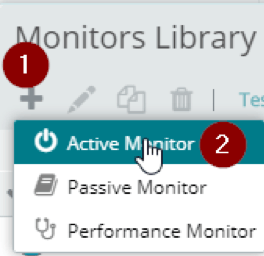
This will bring up the ‘Monitors Library’ dialog box. From here, I am going to click the + sign and select ‘Active Monitor’.
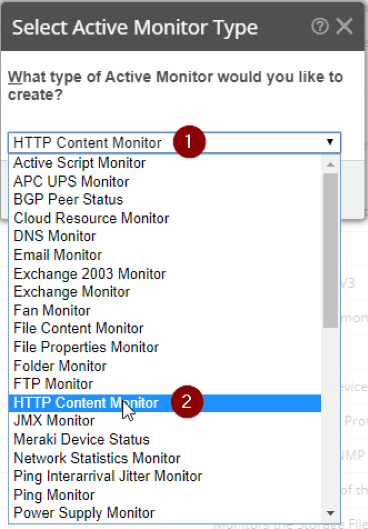
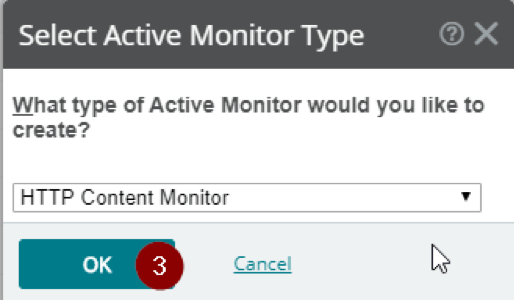
In the ‘Select Active Monitor Type’ dialog, select HTTP Content Monitor and then click ‘OK’
HTTP Content Monitor Settings
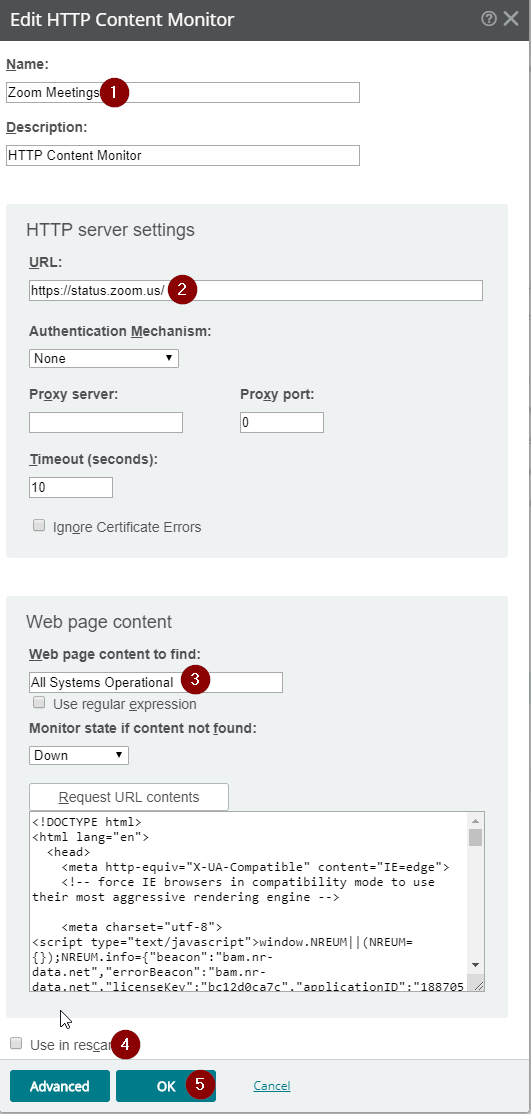
For the name, we let’s call it ‘Zoom Meetings’. For the URL, simply put in https://status.zoom.us/, and for the web page content to find enter “All Systems Operational”. I also suggest unchecking “Use in rescan” for any HTTP Content monitors. When completed, hit “OK”. This will add the monitor to your monitor library.
Test Your Monitor
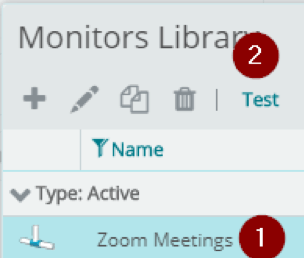
Once the monitor is created, it’s a good practice to test it. In the Monitor Library, select the monitor and click ‘Test’.
From the Test dialog, select a device to test noting that it can be *ANY* device you’re monitoring since the HTTP Content Monitor always launches in the context of the WhatsUp Gold server. Think of a web browser being launched on the WUG server itself and going to the web page we specified in the URL field of the HTTP Content monitor.
So What Does This Monitor Do?
The monitor itself will go to the webpage and verify the content “All Systems Operational” is loading. If the web page here ever did *NOT* contain “All Systems Operational”, the monitor would go down and the administrators could be alerted to investigate further by going to the URL directly. This assists in ensuring employees don’t waste their time trying to access Zoom when there is a known outage – since the administrators know as soon as possible, they can notify the other employees of the company of the outage.
Final Steps
The final step here is to assign the monitor to a device in WhatsUp Gold. Doing so is very simple. Remember my earlier note: the HTTP Content Monitor always runs in the context of the WhatsUp Gold server. This means we can apply it to any device we’d like. What I typically do is create a “dummy” device and add all of my external HTTP Content monitors there. This way they are all aggregated under one device, making it easy to see individual statuses of the monitors from within dashboard reports.
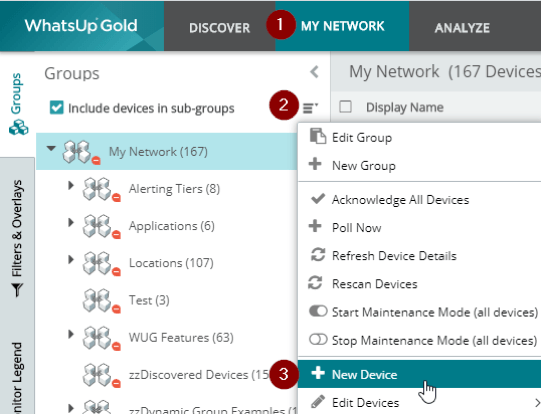
First, let’s add our dummy device. Click to the ‘My Network’ tab, use the Device Group menu and select ‘New Device.’
In the ‘New Device’ dialog, put in 127.0.0.1 as the IP address and select ‘Add device immediately without scanning’ then click ‘OK’.
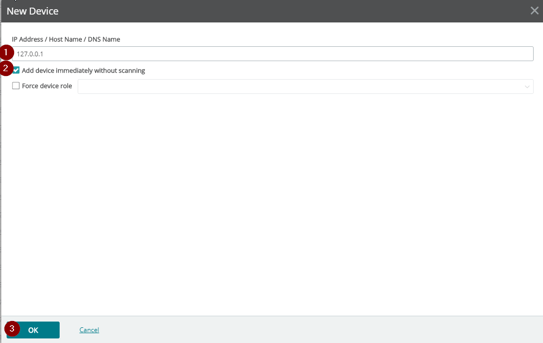
This will bring up the following dialog, just wait for it to finish.
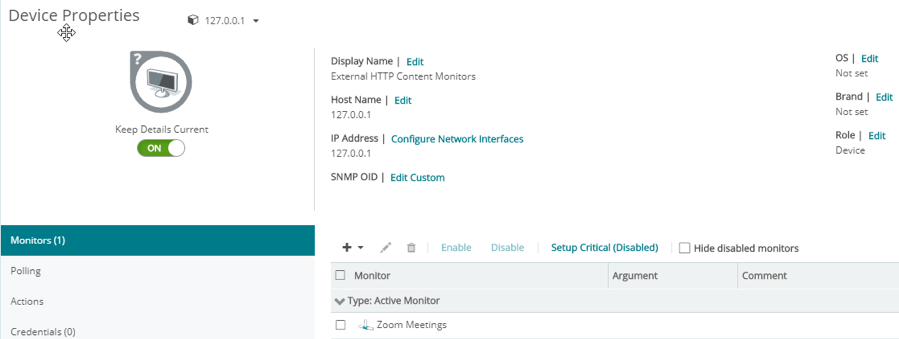
Once completed, bring up the ‘Device Properties’ dialog for the newly added device, it will be named 127.0.0.1. Within the Device Properties, I am going to adjust a few things and add my monitor. First, let’s change the display name to External HTTP Content Monitors. I am also going to remove the ping monitor: it is not relevant here, and I don’t care to see it in my reports. Next, I am going to add the monitor by clicking the + sign, selecting Active Monitor, then select my ‘Zoom Meetings’ monitor, and click ‘OK’. That’s it – you are now monitoring the status of Zoom’s services.
What else?
Well, you now have the ability to associate actions or actions policies with your monitor. Actions can include e-mails, text messages, and much more. Remember this is just *ONE* of *MANY* different ways to accomplish this within WhatsUp Gold. I could for example, do something like what I did here https://wug.ninja/tcpipmonitor/ for the Zoom sign-in process. I could also use WhatsUp Gold’s Application Performance Monitor add-on to use the end-user monitoring capabilities, which allows us to do distributed synthetic browser transactions. I can go on and on here, but we’ll leave it at that for now. Happy Monitoring!