
Network Bandwidth Monitoring Tools
Monitor bandwidth and application performance in real-time using NetFlow, IPFIX, sFlow, J-Flow, NetStream, NBAR, CBQoS data collection for deeper network visibility and control.
Key Benefits of WhatsUp Gold’s Bandwidth Monitoring
Progress® WhatsUp® Gold bandwidth monitoring tools collect, monitor and analyze network traffic volume by endpoint (user), port, interface and protocol (application). Flow data includes source and destination IP addresses as well as source and destination ports. Applications are identified based on the ports used in the conversation, following standard port-to-application mappings.
Provide adequate bandwidth monitoring for business-critical applications
Minimize the impact of non-critical or unauthorized network traffic
Identify bandwidth hogging processes during business hours
Alert potential DDoS attacks or externally initiated port-scans
Monitor Bandwidth with Intelligent Tools
The WhatsUp Gold solution tracks bandwidth usage over all areas of the network–devices, applications, servers, link connections, leased lines and offers actionable insights into network bandwidth utilization and traffic analysis. It also maps out historical trends for capacity planning and proactively identifies security issues.
Real-Time Network Bandwidth Monitoring
Real-time bandwidth monitoring allows administrators to identify interfaces/links/applications/users/protocols that are consuming bandwidth. WhatsUp Gold network monitoring highlights bandwidth utilization over LAN, WAN links and specific devices and identifies internal and external traffic sources/destinations. The report categorizes network traffic into key areas, including Top Talkers (speakers), Top Protocols and Top Applications consuming bandwidth, enabling you to quickly identify usage patterns and performance bottlenecks. Best of all, this capability is available out-of-the-box with WhatsUp Gold Network Traffic Analysis Plus (NTA+).
Apply Quality of Service (QoS) Policies
By default, all traffic types operate on a best-effort basis–every port and application gets equal priority, be it a business-critical VoIP service, or a user streaming video content. Quality of Service (QoS) polices are essential to maintain sufficient bandwidth for business-critical applications. The WhatsUp Gold solution verifies QoS over through Type of Service (ToS), surface potential bottlenecks, CBQoS policies and Cisco NBAR classification mechanisms.
Historical Trends Identification
By studying traffic patterns and usage over a period, and by analyzing the data, WhatsUp Gold network monitoring can identify trends in bandwidth usage and potential bottlenecks. The historical data aids administrators in capacity planning; efficient purchase of hardware/bandwidth and verifies bandwidth-based billing, including “burstable” bandwidth services using 95th percentile reports.
Identify Abnormal Bandwidth Usage
By using WhatsUp Gold NTA+ to monitor real-time bandwidth and historical trends, together with ADS capabilities, you can identify security issues such as DDoS attacks, unauthorized downloads and other suspicious or potentially malicious network activity. It supports security forensics and analysis by automatically:
- Detecting high-volume traffic directed to unmonitored ports
- Uncovering unauthorized applications like file sharing and video streaming
- Monitoring traffic volumes between pairs of sources and destinations
- Discovering failed connections
Monitor Network Bandwidth with WhatsUp Gold
The WhatsUp Gold solution uses NetFlow, IPFIX, sFlow, J-Flow, NetStream, NBAR and CBQoS to monitor network bandwidth and application traffic. It enhances security forensics and analysis by automatically identifying high-volume traffic flows targeting specific ports, helping uncover potential anomalies or suspicious activity. WhatsUp Gold then analyzes the data, providing details on traffic identification and historical trends. Robust reports showing Top Protocols, Top Senders, Top Application and NTA+ reports are provided.
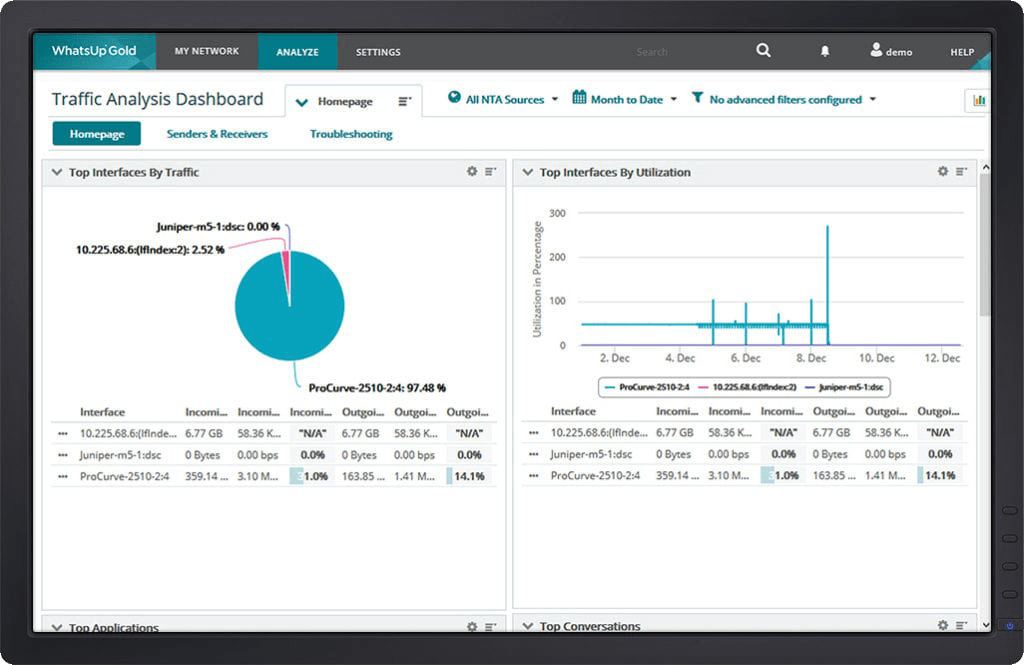 WhatsUp Gold Traffic Monitoring Dashboard
Real-Time Monitoring
Stay ahead of network issues with instant visibility through network bandwidth monitoring. WhatsUp Gold real-time monitoring acts as a powerful bandwidth monitoring system, giving you up-to-the-second insights into traffic patterns across your entire infrastructure. Use the built-in bandwidth usage monitor to identify spikes, bottlenecks and unusual activity as they happen, so you can take immediate action before performance suffers. With customizable dashboards, alerts and a bandwidth speed monitor, you’ll always know what’s consuming your bandwidth, have access to quickly obtain actionable insights and understand where to focus your attention. Whether you need to monitor bandwidth for troubleshooting or capacity planning, the WhatsUp Gold solution delivers the clarity you need.
Historical Reporting and Trend Analysis
Understanding today’s performance is only part of the picture, planning for tomorrow requires data-driven insights. WhatsUp Gold network monitoring provides in-depth historical reporting and trend analysis, enabling you to track usage over time and uncover patterns that impact network health. Generate detailed reports for compliance, capacity planning and optimization. With clear visualizations and exportable data, you can make informed decisions to help prevent congestion and maintain your network scalability to fit your business needs.
WhatsUp Gold Licensing
Flexible licensing options to suit your organization's needs.
Delivers real-time visibility into device health, application performance, and traffic flows so IT teams can ensure uptime, optimize capacity and help prevent service disruptions. Helps reduce operational costs, accelerate troubleshooting and maintain a consistent user experience.
Business
starting from
Enterprise
starting from
Enterprise Plus
starting from
Premium
starting from
Total Plus
starting from