
Imagine starting your car in the morning and having your attention captured by a little red check engine light. After expressing frustration in your own unique way, your next objective is to determine why this little light has brought darkness to your morning. Your owner's manual clearly outlines how to operate and routinely maintain your vehicle, but all you know about this little light is that you’ll soon be meeting your local mechanic. Once there, you watch the mechanic plug a device into your car and grin enthusiastically as he contemplates the magnitude of your repair bill. End scene.
Why describe this painful, yet common scenario? Because it’s a helpful analogy for understanding the relationship between the products we discuss and the importance of network observability. Without notifications and rapid visibility into root causes, managing your organization's network is no different from trying to repair your own vehicle by using the “replace and pray” method.
Gaining essential visibility into your network issues and performance leads to observability, which means actionable insights based on the data you can collect. This expedites root cause analysis, preserves user experience and powers network optimization. In many cases, the benefits of gaining network observability are often diminished by the burden of choosing the right products to power your optimized insights. So how do you know which tool is the best fit for your network traffic analysis needs?
In this blog post, we present and discuss the relationship between two Progress products that aim to provide forensic-level network visibility and management value. These two products are Progress WhatsUp Gold and Progress Flowmon. Let’s start with WhatsUp Gold.
Progress WhatsUp Gold: IT Infrastructure Monitoring
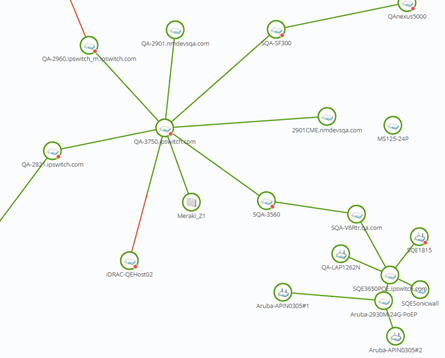
WhatsUp Gold is an IT infrastructure monitoring solution that measures availability as well as performance, helping you to quickly identify and resolve issues in your hybrid cloud network. Monitoring includes core network devices like switches, routers and wireless controllers as well as Windows and Unix systems. Basically, you can monitor anything with an IP address with WhatsUp Gold.
Not only will WhatsUp Gold provide you with detailed metrics of device availability, it can track the performance of your network resources and applications as well as run backups of your device configurations. Bandwidth and traffic monitoring are also integrated into the core functions of WhatsUp Gold. The WhatsUp Gold suite includes features that will collect Syslog and Windows events. Other functions include the ability to notify and run "self-healing" actions to mitigate issues found during the monitoring of your resources.
To support root cause analysis, WhatsUp Gold can monitor the bandwidth and traffic of your switches and routers through Network Traffic Analysis (NTA). It does this through SNMP, the protocol of choice for monitoring not only network resources but also discovery. It is through SNMP that WhatsUp Gold learns about connected devices so it can provide Layer 2 (the network’s data link layer) information. SNMP also provides inventory data about discovered devices such as ARP Tables and Asset details like serial numbers and iOS versions. However, SNMP is limited in terms of telling you what IP addresses are using the most bandwidth or which protocol or application is being transmitted. You have an idea of how much bandwidth and traffic is used, but not who or what is using it.
This brings us back to WhatsUp Gold’s Network Traffic Analysis (also referred to as Network Traffic Monitoring), which can give you basic information like the top 10 conversations using the most bandwidth. You can also see which protocol is transmitted the most. If there are many SQL transactions happening on your network, NTA will reveal it. NTA gathers this information using NetFlow, J-Flow and sFlow protocols. The tool works as a listener. Once you configure your switches or firewalls to send flows to the WhatsUp Gold IP address, they will appear as sources in the NTA library.
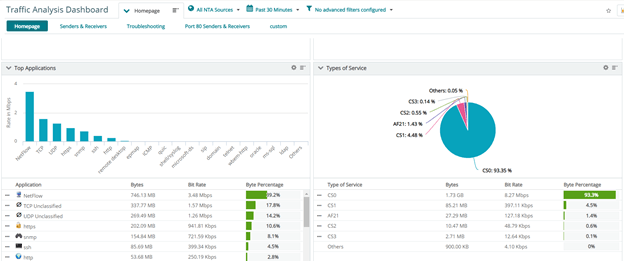
Using the data received from these sources, WhatsUp Gold can create dashboard reports showing you how data is being used over a given time. You can see which conversations are using the most data or what the top receiver domains are.
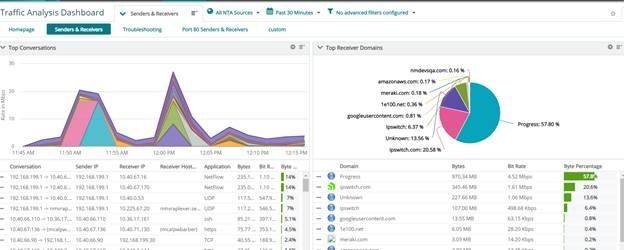
Network Traffic Analysis is a good compliment to SNMP traffic and bandwidth monitoring. You can identify devices by IP addresses that are transmitting or receiving the most data. You can also tell how many conversation partners your devices have, and you can even identify ‘Suspicious Connections,’ a feature that uses sites like the Tor Project to identify dark sites. WhatsUp Gold NTA takes your IT team further into understanding how network traffic is being used in your network.
Progress Flowmon for Network Traffic Analysis
Flowmon is a network monitoring solution that enables you to optimize your network performance and security with full visibility and decisive intelligence. It is powered by its network-centric monitoring vantage point coupled with the advantages involved in using flow as the basis for all the insights and details it provides. Flowmon allows you to pinpoint the root cause of network problems, gives you complete network visibility and spots security threats with ease thanks to its AI engine and unmatched flexibility.
Flowmon, as indicated in its name, is completely flow-based. However, it is not limited by the lack of information provided by traditional flow standards or by the sampling that occurs when offloading flow from existing network devices. Flowmon saw an opportunity to leverage the lightweight nature of an existing network monitoring solution in flow and make it better.
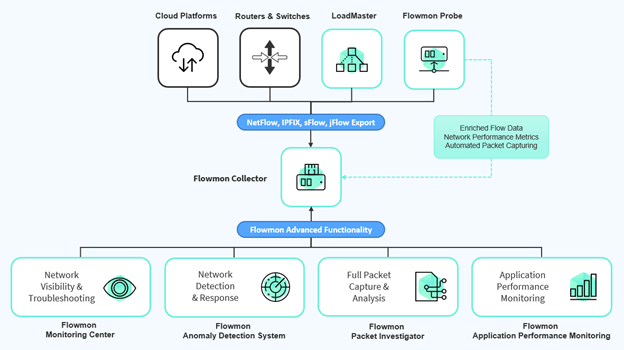
Flowmon Probe is the most powerful flow generator on the market, and its primary role is to generate deeply enriched flow from the raw packets that it monitors inside of a network. It simultaneously generates network performance metrics and conducts deep packet inspection on an array of protocols to extract key information and inject that information into custom IPFIX format flow fields.
The result is unsampled and enriched flow stored within our Flowmon Collector, providing forensic-level visibility into your network activity. Flowmon provides the ability to store deeply detailed historical network traffic in flow form which is a 250 to 500 times lighter alternative to storing packets.
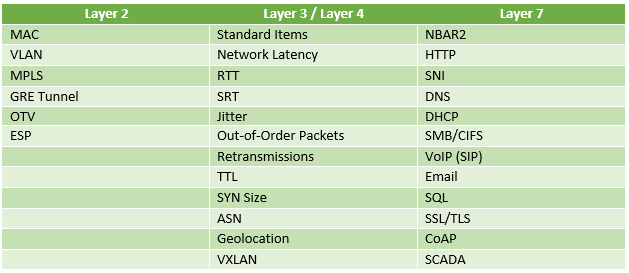
Being completely flow-based, Flowmon does indeed support the ingestion of all flow standards from third-party network devices as well as native flow logs from cloud platforms such as Azure, AWS and Google Cloud. That said, the full magnitude of Flowmon's power is unlocked when it conducts the flow generation on behalf of the Flowmon Probe in addition to the storage and analysis of the flow data. Flowmon can capture key details such as those outlined in the chart below at Layers 2, 3, 4 and 7 and inject the information into custom IPFIX flow fields.
The Flowmon Collector then takes all those stored flows and enables you to define custom dashboards and reporting as well as automated alerting in the analysis of their stored network flows. As a result, Flowmon allows you to:
- Gain comprehensive visibility into your entire hybrid cloud environment.
- See performance degradation and distinguish between delays caused by the network itself and delays caused by applications and services.
- Quickly find the root cause of any issue with automated detection, predictive insights and relevant suggestions for remedial actions.
Going further, Flowmon's advanced visibility modules provide network detection and response, automated packet capturing and analysis and HTTP/SQL application performance monitoring capabilities. A key benefit is how these modules support operational collaboration between NetOps, SecOps and Application teams within the same organization. Flowmon meets the needs of these different teams by helping them to understand their networks, defend against growing threats and conduct rapid root cause analysis when troubleshooting issues.
Here is an architectural breakdown of Flowmon and its advanced network monitoring capabilities:
Comparing The Two Products for Network Traffic Analysis
Remember the scenario of vehicular horror at the start of this blog? Here’s the big reveal: WhatsUp Gold is the check engine light that alerted you to a problem and Flowmon is the diagnostic tool that your mechanic plugged into your car to explain exactly what was wrong. As you would imagine, it isn’t that cut and dry, but I use this analogy often because it gets the listener to consider how these two solutions can operate in a complimentary manner.
To see what I mean, consider the summary chart below. It highlights the differences between WhatsUp Gold and Flowmon while also calling attention to how these products can be deployed together to gain full Infrastructure, Application, Network and Security monitoring visibility.
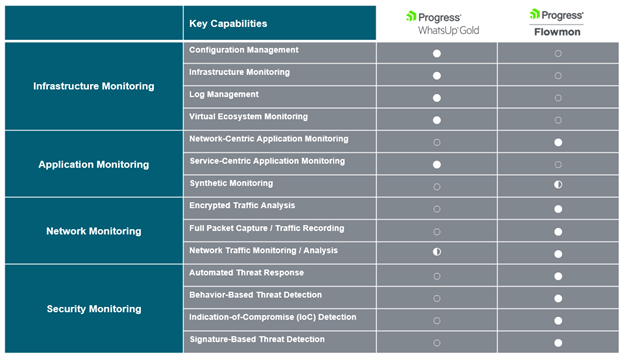
When deployed and managed together, WhatsUp Gold and Flowmon guide you through the lifecycle of an issue from identification to resolution. The difference between most of their monitoring features resides primarily within the vantage points from which they monitor your network. Flowmon monitors from the vantage point of your deployed network devices by connecting to mirrored/span ports, TAPs and ingesting mirrored traffic or generated flows. WhatsUp Gold communicates with endpoints within your environment to provide visibility into how they and their dependencies within the network are performing.
However, as you can also see in the chart, the one area of overlap is Network Traffic Monitoring and Analysis. The WhatsUp Gold Network Traffic Analysis module ingests flow data from devices deployed within your network just as Flowmon does. So how would you decide when to use the WhatsUp Gold NTA tool for flow monitoring or when to transition to Flowmon's completely flow-based solution?
It comes down to your operational use cases and the depth of information and coverage you require. WhatsUp Gold uses the flows that it collects from network devices to provide details about top talkers, bandwidth utilization and communication dependencies, and it can even highlight suspicious communications within an environment. But being dependent on flow generated by your network devices can mean you are limited to flows representing samples of your actual network traffic—as opposed to having all network traffic captured. In addition, you may be limited to the standard of flow your network device supports, which means your stored flows might not contain the details you require.
For flows generated by network devices within an environment, Flowmon can do the same while adding the ability to define custom dashboards and widgets, automate alerting based on flow activity and drill down. With the ability to drill down into each stored flow, administrators can analyze all the flows stored within the Flowmon Collector. Taking it a step further, Flowmon is not entirely dependent on flow generated by third-party network devices but can instead generate un-sampled and enriched flow itself. These flows are essential in providing visibility into network performance as well as the more granular visibility required to conduct root cause analysis.
So, the decision point for determining whether to use WhatsUp Gold's Network Traffic Analyzer for flow analysis or to move on to Flowmon comes down to your specific operational needs and devices and whether you want the ability to granularly analyze flows and define custom dashboards, widgets, reports and alerts.
Summary
WhatsUp Gold and Flowmon provide unique features and abilities that contribute to achieving optimized network observability. They complement one another by providing users with visibility into the different categories of network monitoring. The small amount of overlap in these two products is their flow-based features for traffic monitoring and analysis. The difference is:
- WhatsUp Gold provides entry-level abilities for ingesting flow and providing pre-defined dashboard-based insights.
- Flowmon goes much deeper, using flow as a basis to gain forensic-level insights into the state of networks and offering the freedom to design the solution to highlight the insights you care about most.
In 2022, we built a new integration between the two platforms to offer customers the best of both worlds: the check engine light and the diagnostic tool! Organizations that have deployed both products can gain critical network insights quickly and troubleshoot issues with the ability to visualize Flowmon data in dashboards within WhatsUp Gold's user interface.
How to Learn More
For an outline of the integration between WhatsUp Gold and Flowmon and key visuals, read this blog post. In addition, we have published a second blog post that outlines how you can use both solutions to solve key user experience issues and conduct rapid root cause analysis.