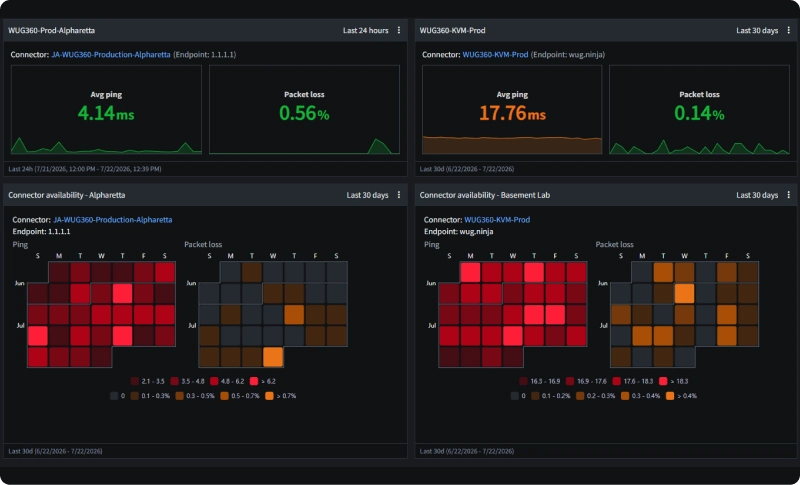
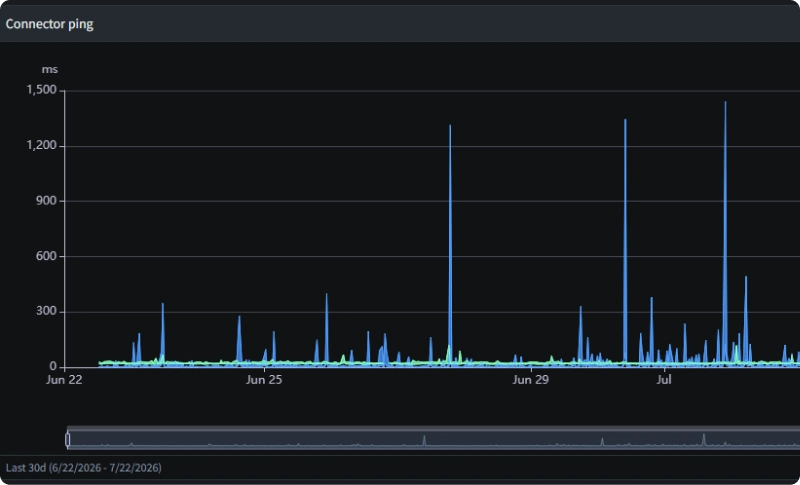
Visualize traffic paths, detect latency and route issues, and troubleshoot network performance problems before they disrupt users.
A slow application does not automatically mean the server is slow. The delay may begin on a branch WAN link, an overloaded VPN gateway, a carrier handoff, a cloud transit route or a provider-controlled segment that the internal network team cannot inspect directly. The hard part is separating those possibilities while the incident is still active.
Command-line traceroute remains useful for a quick check. It reveals a sequence of responding interfaces by sending probes with increasing IP time-to-live values and recording ICMP Time Exceeded responses. That output is a snapshot from one source at one moment. The tool does not retain historical routing information, cannot identify route flapping over time and cannot determine whether an unresponsive traceroute hop is still forwarding production traffic. Routers frequently rate-limit or suppress diagnostic replies, and load balancing can cause successive probes to follow different paths.
Network path monitoring closes that evidence gap by running measurements repeatedly from a defined vantage point to a defined destination. The useful output is not simply a prettier traceroute. It is a time series: which hops responded, how long probes took, where loss first appeared, whether the destination remained reachable and what changed around the time users noticed a problem.
That distinction matters most for intermittent faults. A NOC engineer investigating at 14:30 may find a healthy path even though users experienced severe delay at 13:55. Historical path data gives the engineer something concrete to compare: the normal route, the incident route, and the point at which response times changed.
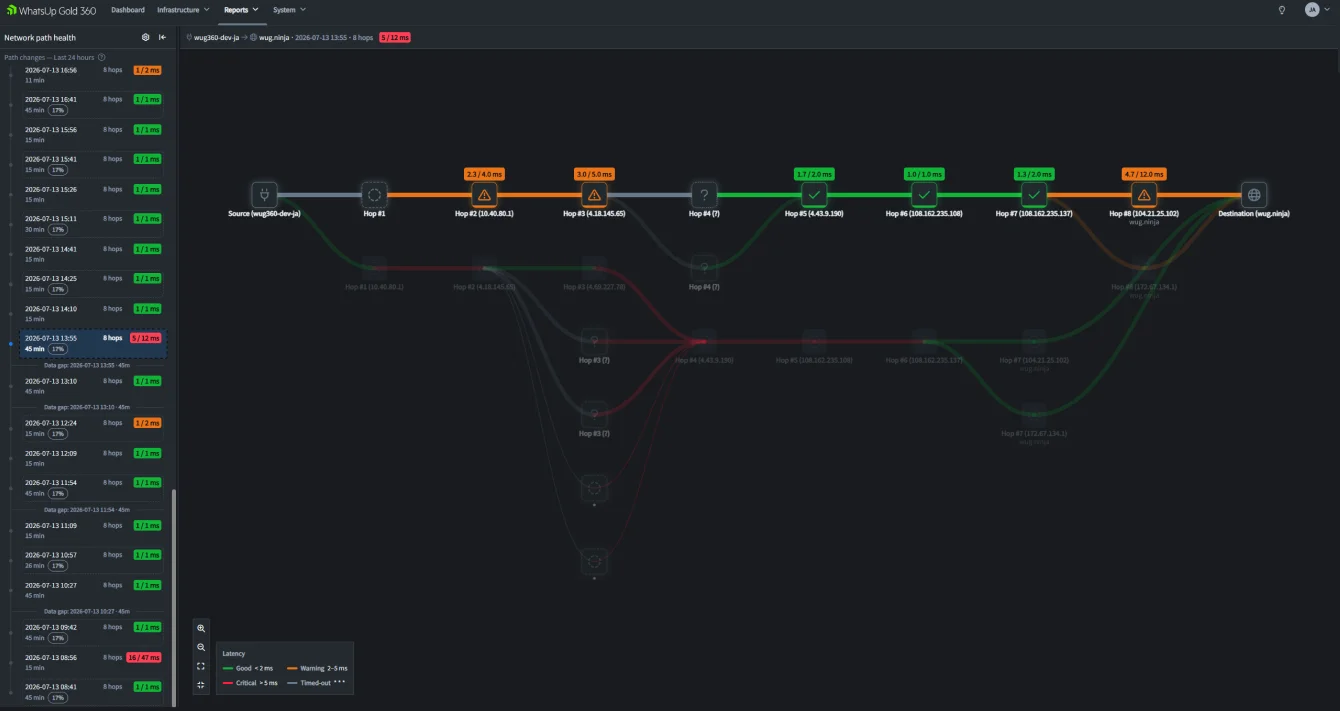
A path view narrows the search area. When latency is normal through the campus and rises after the ISP handoff, the next action is different from a case where delay begins at the first-hop firewall. The view should help an operator identify the first sustained change, not merely highlight the hop with the highest number. A single slow ICMP reply can reflect control-plane rate limiting rather than forwarding delay.
Without stored path data, administrators often repeat ping, traceroute, interface checks and application tests from several locations. Continuous measurements preserve the state that existed during the incident. This reduces time spent trying to recreate a condition that has already disappeared and gives the incident record a shared technical reference.
Internet and WAN routes change for legitimate reasons, including routing policy, maintenance, failure recovery, SD-WAN decisions and upstream traffic engineering. A route change is not automatically a fault. It becomes relevant when it lines up with higher delay, loss at the destination, failed transactions or a change in user experience. Experienced operators correlate the route event with service symptoms before assigning blame.
A screenshot that shows the source, destination, incident time, route and first observable degradation is more useful than “the network is slow.” It does not prove ownership on its own, especially across provider networks, but it gives the receiving engineer a precise time window and path segment to investigate.
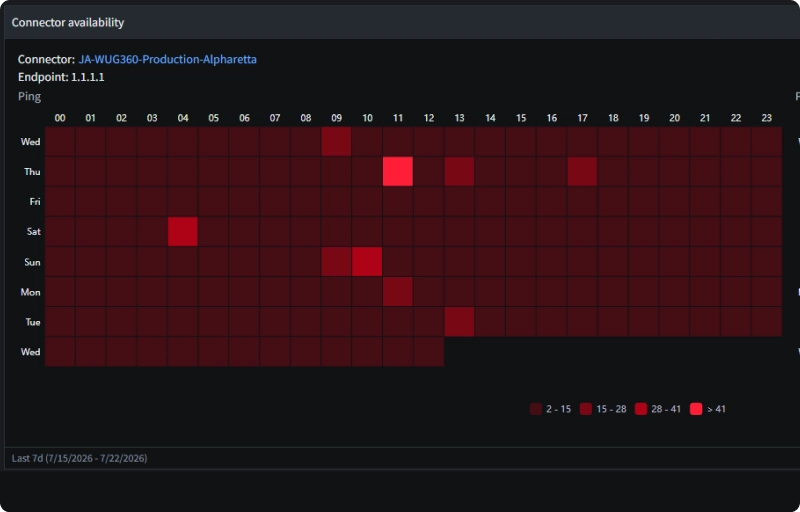
Consider a branch office where an ERP application becomes sluggish for ten minutes each afternoon.
The server team sees normal CPU and database response. The branch router reports no sustained interface saturation. A one-off traceroute taken later shows a normal route.
Historical path monitoring changes the investigation. The route timeline shows that traffic moved to a secondary carrier path during the affected window. Hop response increased immediately after the carrier edge, while the destination also showed high end-to-end latency. That pattern does not prove the carrier caused the problem, but it gives the network administrator a focused escalation: exact timestamps, affected source and destination, the route change, and the measured impact.
Network path monitoring closes that evidence gap by running measurements repeatedly from a defined vantage point to a defined destination. The useful output is not simply a prettier traceroute. It is a time series: which hops responded, how long probes took, where loss first appeared, whether the destination remained reachable, and what changed around the time users noticed a problem.
That distinction matters most for intermittent faults. A NOC engineer investigating at 14:30 may find a healthy path even though users experienced severe delay at 13:55. Historical path data gives the engineer something concrete to compare: the normal route, the incident route, and the point at which response times changed.
Map the observed route between a monitoring source and a target such as a business application, branch gateway, cloud workload, or SaaS endpoint. A useful map shows hop order, address or resolved name, response state, and the measurement time.
Measure response over time at each visible hop and at the destination. Operators should look for sustained changes that continue downstream, compare against the same source and target, and account for different treatment of diagnostic traffic.
Record when the observed path changes and retain enough history to compare normal and incident periods. This is valuable for flapping routes, failover events, asymmetric connectivity, and complaints that arrive after the route has recovered.
Run measurements from locations that reflect real traffic: a headquarters network, branch, data center, cloud subnet, or remote access segment. One central probe cannot represent every user population. For example, a SaaS service may perform well from the data center while remote employees traverse a different ISP, VPN concentrator, DNS answer, or content-delivery edge.
Alert on conditions an operator can act on, such as destination loss, sustained end-to-end latency, repeated route churn, or a path change followed by degraded service. Alerting on every changed hop creates noise because public routes and load-balanced paths are expected to vary.
Instead of relying on isolated traceroute results or manually comparing device metrics, teams can visualize the complete route traffic takes and quickly identify where latency, packet loss or routing issues begin.
Network problems don’t always happen while someone is watching. Continuous path monitoring builds a historical record of path changes and performance trends, making it much easier to investigate intermittent issues after they’ve occurred.
Modern application traffic moves between branch offices, data centers, cloud platforms, SaaS providers and ISP networks. Monitoring those paths from end to end helps pinpoint whether the issue originates inside your network or beyond your infrastructure.
Rather than alerting only when a device goes offline, path monitoring detects meaningful changes such as increased hop latency, unexpected route changes and packet loss. This gives administrators context before users begin reporting performance problems.
When an issue lies with an ISP, cloud provider or another infrastructure team, visual path maps and historical performance data provide concrete evidence of where degradation starts. That reduces back-and-forth during incident response and helps the right team take ownership sooner.
| Capability | Basic Traceroute | Continuous path analysis |
|---|---|---|
| Single, immediate path check | Strong fit | Available as part of a wider workflow |
| Historical comparison | No built-in history | Stores measurements for incident review |
| Route-change context | Manual comparison | Highlights changes over time |
| Multiple monitoring locations | Run manually at each source | Uses deployed vantage points, subject to product architecture |
| Escalation record | Copy raw command output | Provides time-aligned visual and historical evidence |
| Accuracy under load balancing | Can show inconsistent or misleading hop sequences | Still probe-dependent; repeated history improves context but does not remove measurement limits |
Traceroute is not obsolete. It remains the fastest way to ask a narrow question from a shell. The outdated practice is treating one trace as conclusive evidence of the application path, assuming every silent hop is a failure or keeping no history for intermittent services. Continuous monitoring is the better default for critical paths.
Every network is different, but the troubleshooting process is the same: start by monitoring the paths that matter most, establish a baseline for normal performance and expand visibility as your environment grows. Whether traffic stays within a single site or crosses cloud providers, ISPs and SaaS platforms, continuous path monitoring provides the context needed to investigate performance issues with confidence.
WhatsUp Gold is designed to fit into existing network operations rather than forcing a new monitoring model. Whether you manage infrastructure on-premises, across multiple sites, or in a hybrid environment, path monitoring can be introduced gradually by focusing on the applications and services that carry the greatest operational risk.
Rather than monitoring every possible destination from day one, begin with the services that users rely on most. Authentication platforms, ERP systems, VoIP services, VPN gateways, customer-facing applications, and key SaaS platforms are often the first paths administrators choose to monitor because they have the greatest impact when performance degrades.
As confidence grows, coverage can be extended to additional branch offices, cloud workloads, endpoints and remote locations without overwhelming operators with unnecessary alerts.
Knowing that a connection is slow is only part of the story. Effective path monitoring records the information needed to explain why performance changed, allowing administrators to compare current behavior with historical trends.
This typically includes route information, hop-by-hop latency, packet loss, response behavior, route changes and historical performance metrics that help distinguish intermittent issues from persistent faults.
Path monitoring becomes more valuable when it supports the workflows your operations team already follows. Alerts should feed existing dashboards, ticketing systems and NOC processes so incidents can be investigated without switching between multiple tools.
Use a guided evaluation to map the routes that matter, place monitoring points where they represent real traffic, and test how WhatsUp Gold records a path change or service degradation in your environment.