What is Network Monitoring?
Network Monitoring is the process of discovering, mapping, and monitoring a computer network to ensure optimal availability and performance. The only way to know if everything on a network is operating efficiently is with a network monitoring tool like WhatsUp Gold.
This article covers basic network concepts like the OSI seven layer model, common device types, and the five functions of network monitoring systems.
Open Systems Interconnect (OSI) Model
Understanding of basic networking begins with the Open Systems Interconnect model.
The OSI model standardizes the key functions of a network using networking protocols. This allows different devices types from different vendors to communicate with each other over a network.
In the OSI model, network communications are grouped into seven logical layers. Two devices communicate using OSI standardized protocols at each layer.
The OSI Seven Layer Model
| Layer | Function |
|---|---|
| Layer 7: Application | Interacts with software applications that implement a communicating component. |
| Layer 6: Presentation | Converts incoming and outgoing data from one presentation format to another (Data encryption, text compression). |
| Layer 5: Session | Controls the connections between computers. Establishes, manages and terminates the connection. |
| Layer 4: Transport | Ensures data transfer from a source to a destination host across one or more networks. |
| Layer 3: Network | Routes data packets between two nodes on a network using an IP address |
| Layer 2: Data Link | Provides a reliable connection between two connected nodes by detecting errors at the physical layer. |
| Layer 1: Physical | Transmits a bit stream over physical media such as coax or fiber cable. |
The Datalink (2), Network (3), and Application (7) layers are the most common used for monitoring. Network monitoring systems use these layers to discover the devices on the network and how they are connected, to generate network topology maps, and to monitor the network.
Common Network Devices
Routers
Routers connect networks. For example, connecting a private network to the internet. A router acts as a dispatcher, choosing the best path for the information to travel. Routers connect users to the internet. Routers are Layer 3 devices
Switches
Switches connect computers, printers, servers and other devices to the private network. A switch works as a controller enabling devices on the network to communicate with each other. Switches are Layer 2 devices
Firewalls
Firewalls protect networks. A firewall controls incoming and outgoing traffic based on rules. This creates a secure barrier between a trusted private network and an untrusted network, like the Internet.
Servers
Networks deliver applications and information to users. Applications and information live on servers. A server is a running instance, or copy of an application. Servers take requests from users and respond accordingly. For example, when you access a website, a web-server “serves” up webpages to your local device. Other examples of servers are email servers, and database servers.
How Data Passes Through a Network
Most private networks are connected to the internet. For example, the internet connects remote users to central offices. It connects customers to websites.
Private networks are connected to the internet using routers. Information is sent over the internet in the form of data packets. Each data packet includes a destination IP address which routers use to send information from one location to another. When a router receives a data packet from the internet, it forwards it to the private network.
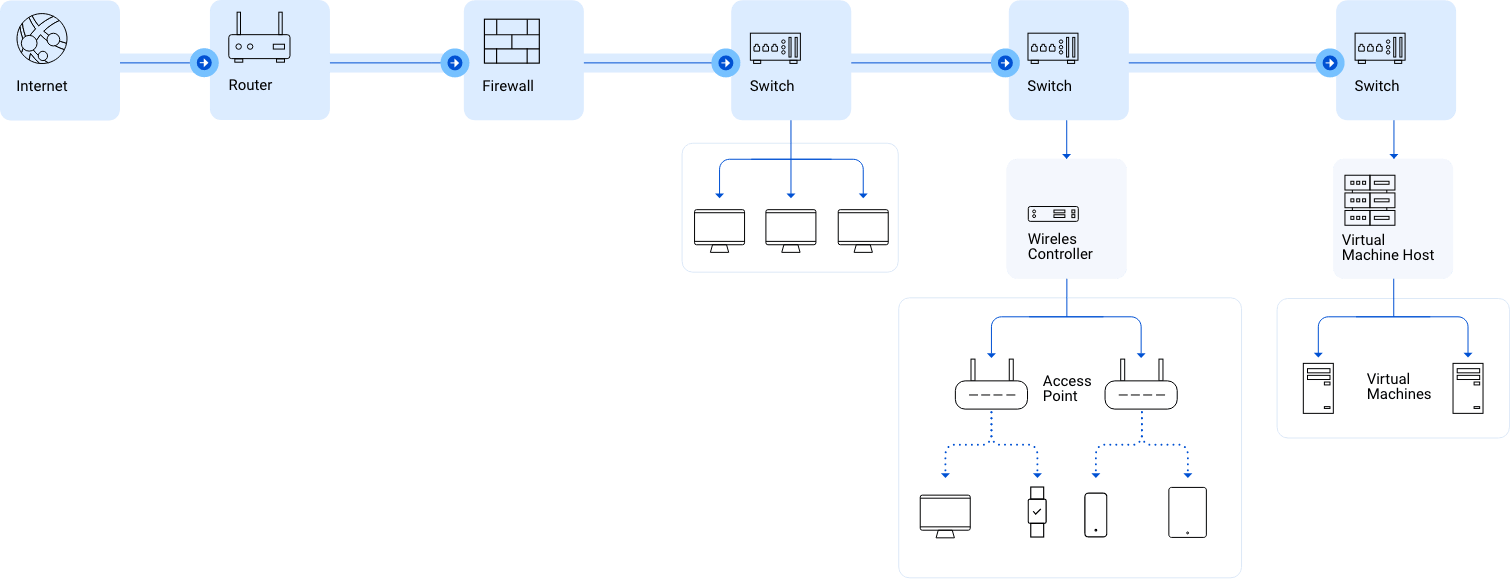 Diagram of data passing through a network (click to enlarge)
In most networks, data packets must first pass through a firewall. It’s purpose is to keep bad traffic out and keep the private network secure. A firewall does this by filtering traffic between the internet and private network. When an incoming data packet is flagged by firewall rules, it is blocked from the private network.
Firewalls also control user access between the internet and the private network. For instance, a firewall can be configured to prevent users on the private network from using specific protocols such as peer to peer. This is one way that Firewalls secure private networks from unauthorized access, malware and other security threats.
Data packets passed through the firewall are received by a switch on the private network. Switches connect laptops, servers, printers and other devices to the private network. These devices are connected to the switch using a Network Interface Card, or NIC for short. Each NIC has a unique Media Access Control, or MAC address. Switches transmit data between devices using these MAC addresses.
Why Monitor a Network?
So why is it important to monitor networks? The network is the life line of the IT infrastructure. When networks fail, the flow of information required by applications and business operations stop.
Networks are dynamic environments. Network Admins are continually asked to add new users, technologies and applications to their networks. These changes can impact their ability to deliver consistent, predictable network performance.
When network problems arise, Network Admins are pressured to identify the root cause before it impacts users, applications and the business. This is more problematic with intermittent performance problems which are hard to replicate and diagnose.
In order to ensure optimal network performance, most IT organizations are subject to Service Level Agreements, or SLAs.
What are SLAs and why are they important?
A Service Level Agreement (SLA) is a contract between IT and Line of Business Owners that commits to providing a certain level of network performance and uptime. SLAs are a performance guarantee, are measured and reported on, and are often tied to IT compensation plans.
Why are SLAs important? Because poor performance and down time is costly. For an eCommerce website like Amazon, one hour of downtime can cost millions in lost revenue.
SLA requirements can be very strict. For example, A "four nines" SLA requires 99.99% uptime. This allows for less than one hour of downtime per year. The more demanding the SLA, the more costly it is to implement and maintain. For example, Delivering four or five nines requires network admins to configure their network switches in redundant pairs, AND have a third switch readily available to swap in case of failure.
The Five Functions of Network Monitoring Systems
We’ve talked about the basics of networking, now let’s talk about the basics of Network Monitoring Systems, or NMSs.
Network Monitoring Systems provide five basic functions:
- Discover
- Map
- Monitor
- Alert
- Report
NMSs differ in the capabilities they delivery for each of these functions.
Discover: Find the Devices on Your Network
Network monitoring begins with the discovery process. Simply put, if you don’t know what’s on the network and how its all connected, you can’t monitor it. Network Monitoring Systems, like WhatsUp Gold, discover all of the devices on the network – the routers, switches, firewalls, servers, printers and more.
NMSs include a library of monitoring templates, which defines how to monitor a device. In WhatsUp Gold, we call these templates Device Roles. Device roles are type and vendor specific. For example, what you monitor on a Cisco Router will differ from what you monitor on a Dell Server.
When a network monitoring system completes the discovery process, it automatically assigns an appropriate device role to each discovered device.
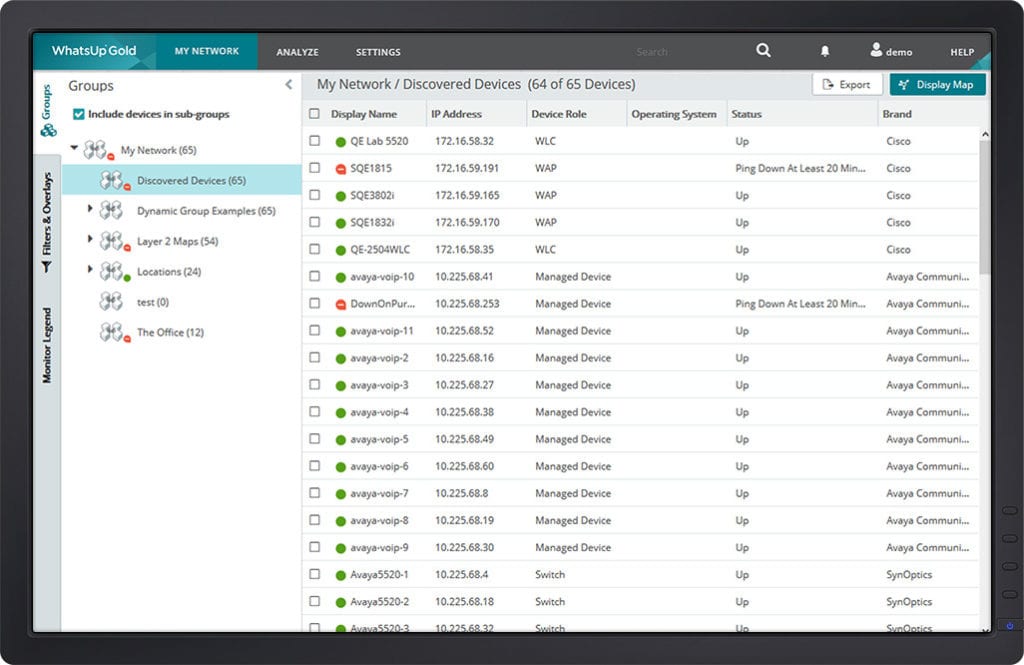 List of discovered devices
Network Monitoring Systems differ in their discovery capabilities. All NMSs discover devices on the network. However, not all will discover how devices are connected to the network. For instance, a NMS may have identified a server on the network but it won't know what switch it is connected to.
A network monitoring tool, like WhatsUp Gold, with Layer 2/3 discovery will discover the port-to-port connectivity between devices on the network and automatically determine how they are connected. For effective network monitoring it’s not enough to know what’s on a network, you need to know how its all connected.
Why? Because a performance problem on one device can impact the performance of another. For example, when a switch fails, all devices connected to that switch can’t communicate over the network. This is a big problem if this is the switch connecting the servers supporting an organization's CRM system.
Map: Visualize Your Network
A network admins eyes are their most valuable diagnostic tool. Their ability to visualize their networks can saves hours, and even days troubleshooting network problems.
To help network admins visualize their networks, network monitoring systems generate network maps. Network maps provide a clean and orderly visual representation of the devices on a network, how they are connected, and up-to-date status information.
Many network mapping tools require a significant amount of manual processing to create a network map. Some tools merely provide a drawing tool and rely on the Network Admin’s knowledge to map out the network. Other tools, such as WhatsUp Gold, can automatically discover everything connected to your network and build a complete map of network devices and their port-to-port connectivity.
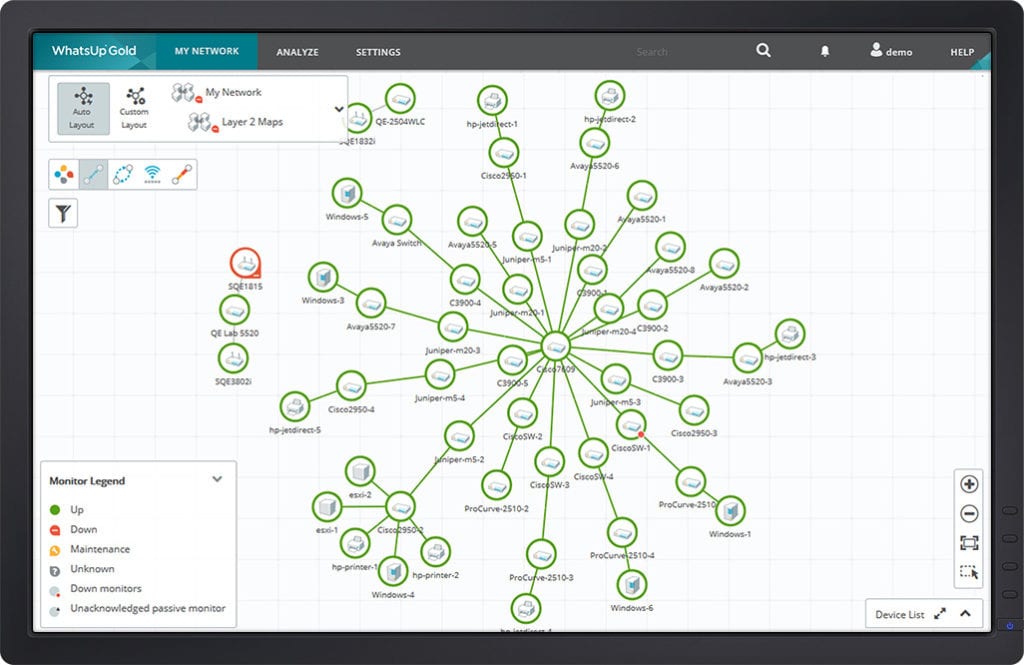 A WhatsUp Gold Network Map
Device Dependencies
A network monitoring system should be able to automatically identify network dependencies. During the discovery and mapping process, tools like WhatsUp Gold automatically identify device dependencies, marking them on the map with directional arrows. Detecting downstream dependencies allows for easy alarm suppression, preventing alert storms.
What are alert storms? In larger networks, sysadmins will daisy-chain multiple switches otherwise known as “cascading”. A failed switch at the head of a chain (upstream) will generate hundreds of unnecessary alerts throughout the chain (downstream). We call this an alert storm. Alert storms can overwhelm an IT team and waste several hours of valuable time.
Custom Maps
Some NMSs allow users to customize network maps in hierarchical or spoke formats, or completely custom views. In WhatsUp Gold you can even upload an image of your office floorplan and visually map your network based on the layout of your office.
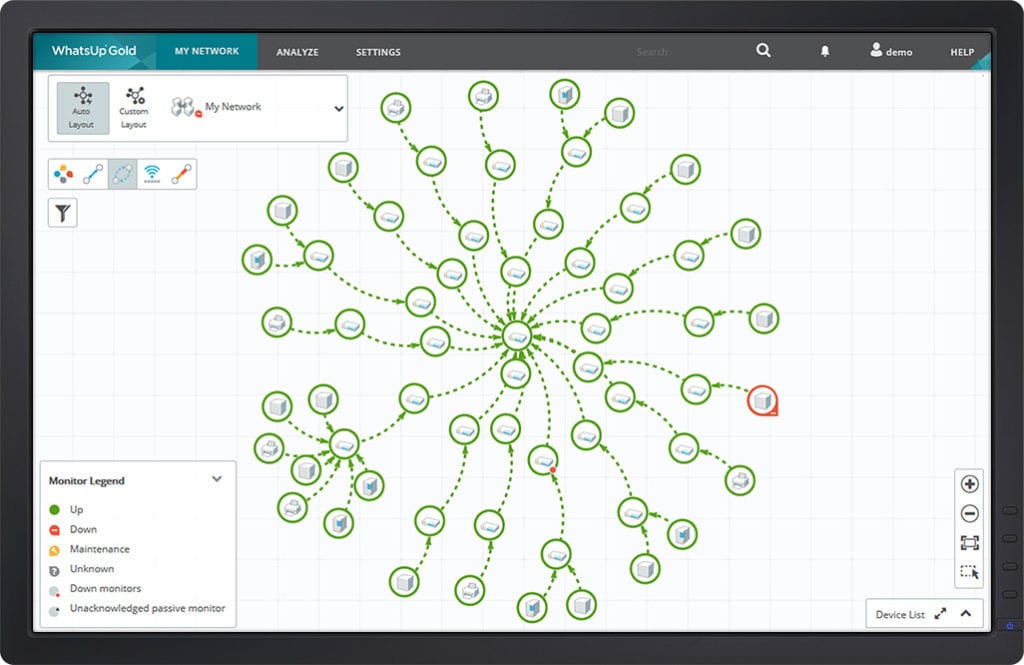 Mapping Device Dependencies
Monitor: Keep an Eye on Your Network
As we stated, Network Monitoring Software provides turn-key device roles that define what to monitor. Network admins can modify device roles or create new ones from scratch. NMSs expose network admins to a large selection of monitors.
As a starting point, network admins want to monitor the “big 5” for any device on the network. This includes Ping availability and latency, and CPU, memory, disk and interface utilization.
Most network monitoring tools provide monitors for other hardware components like the fans and power supplies in a switch, and even monitor the temperature in a wiring closet. They can also monitor network services like HTTP, TCP/IP and FTP
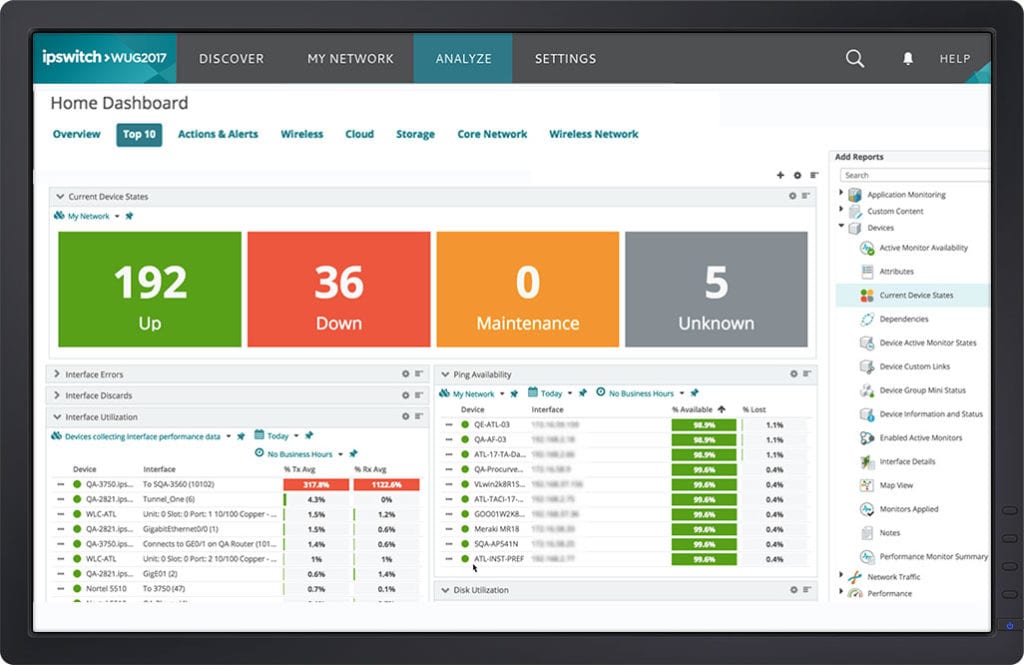 Overview Dashboard
Alert: Get Notified When Devices Go Down
Network Monitoring Systems notify Network Admins when something goes wrong. They deliver alerts via email, text and logging.
Threshold based alerting enables network admins to respond to problems before they impact users, applications or the business. For example, the NMS is configured to issue an alert when the CPU utilization on a router exceeds 80%. This allows the network admin to proactively investigate and respond before the router fails altogether.
Performance metrics like CPU, memory and interface utilization fluctuate during the day. They may exceed thresholds for a few seconds or minutes during periods of peak usage. Network Admins don’t want to be bothered with these minor blips. To avoid this, NMS alerts are configured with a time elements. For instance, if CPU utilization exceeds 80% for more than 10 minutes, then issue an alert.
Believe it or not, Network Admins need to eat, sleep and spend time with their families. Some NMSs let Network Admins configure blackout periods, when alerts are suspended. For example, to save energy costs, printers to shut down at night. NMSs can be configured to suspend alerts from printers during the evening hours
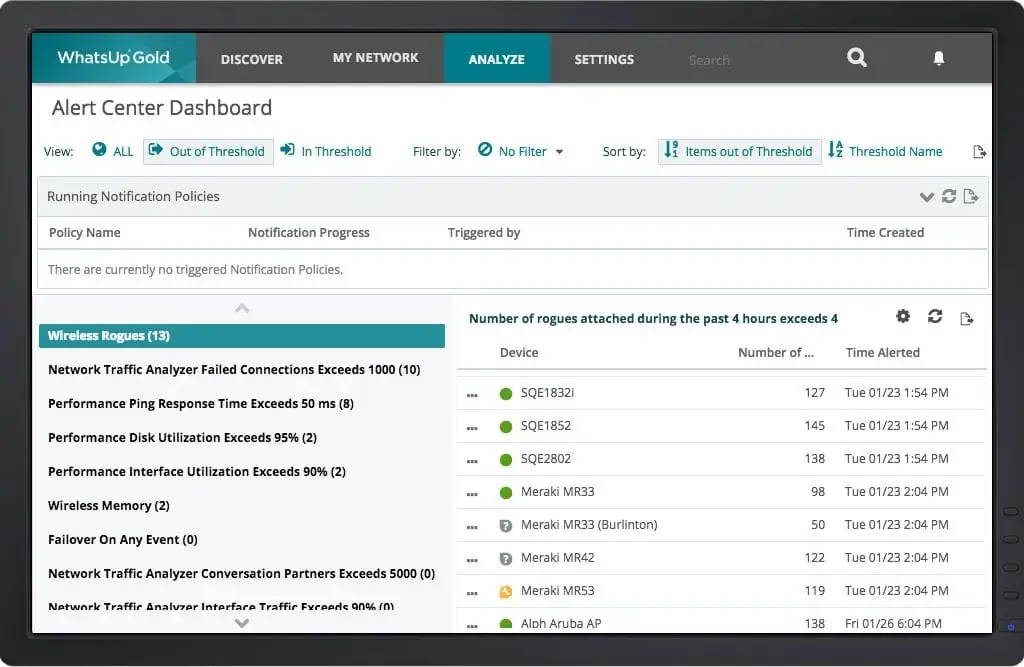 Alert Center Dashboard
Report: Deliver on SLAs with Real-time and Historical Reporting
Network admins are engaged in a continuous life cycle of designing, analyzing and redesigning the network.
To support this life cycle, NMSs systems provide real-time and historical monitoring data. This information enables Network admins:
- To validate that network designs are delivering the desired results
- To expose trends that could impact the ability of the network to deliver the performance demanded by users, applications and the business
- To isolate and fix performance problems quickly
- And to provide proof that SLA commitments are being met.
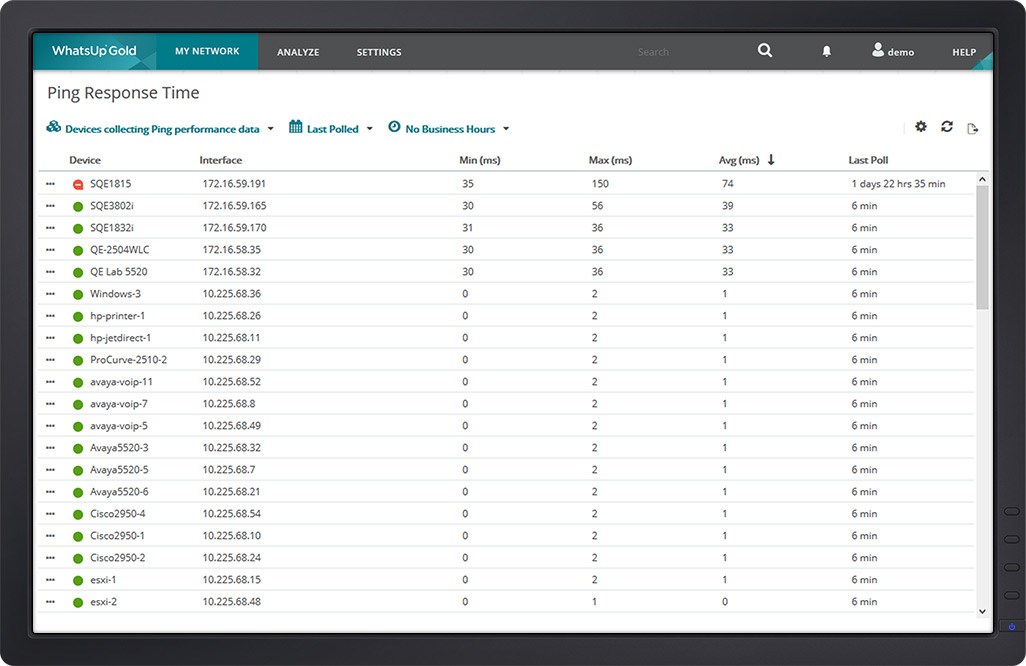 WhatsUp Gold Ping Response Time Report
NMSs deliver monitoring information in webpages called dashboards. Dashboards are made up of turn-key views. For example, a top 10 CPU utilization view or a Top 10 Memory utilization view.
Network Admins scan summary dashboards to assess the health of the entire network. And then drill down with detailed dashboards of specific devices and monitors to quickly isolate performance problems
Most NMSs are customizable. Network admins can create dashboards for their internal clients – Their managers, line of business owners, Help Desk, and counterparts managing systems and applications
How Does a Network Monitoring Tool Monitor the Network?
Network Monitoring Systems poll network devices and servers for performance data using standard protocols such as:
- SNMP, Simple Network Management Protocol
- WMI, Windows Management Instrumentation
- And SSH, Secure Shell for Unix and Linux server
Some NMSs support scripting languages like Powershell – to create custom monitors for Windows Servers, and SQL queries – to create custom monitors for databases.
The two most widely used monitoring protocols are SNMP and WMI. They provide Network Admins with thousands of monitors to assess the health of their networks and the devices on them.
Simple Network Management Protocol (SNMP)
SNMP is standard protocol that collects data from almost any network attached device, including: Routers, Switches, Wireless LAN Controllers, wireless Access Points, Servers, Printers and more.
SNMP works by querying “Objects”. An object is something that an NMS collects information about. For instance, CPU utilization is an SNMP object. Querying on the CPU utilization object would return a value that an NMS uses for alerting and reporting.
The Objects queried by SNMP are maintained in a Management Information Base, or MIB. A MIB defines all the information that is exposed by the managed device. For example, the MIB for a Cisco router will contain all objects, defined by Cisco, that can be used to monitor that router such as CPU utilization, memory utilization and interface status.
The objects in a MIB are catalogued using an standardized numerating system. Each object has its own, unique Object Identifier, or OID.
Some NMSs provides a MIB Browser. A MIB Browser allows Network Admins navigate thru a MIB to find additional objects that they want to monitor on a device
Windows Management Instrumentation (WMI)
WMI is the Microsoft implementation of Web-Based Enterprise Management, a software industry initiative to develop a standard for accessing management information in the enterprise.
This protocol creates an operating system interface that receives information from devices running a WMI agent. WMI gathers details about the operating system, hardware or software data, the status and properties of remote or local systems, configuration and security information, and process and services information. It then passes all of these details along to the network management software, which monitors network health, performance, and availability.
Although WMI is a proprietary protocol for Windows-based systems and applications, it can work with SNMP and other protocols. However, Microsoft has deprecated WMI commands in Windows in favor of CIM cmdlets, so if you're using PowerShell to manage WMI you should be using those instead.
Want to learn more about network monitoring?
Try these helpful resources.
Educational Blogs
What Is Cloud Monitoring? Why Do You Need It?
If all or part of your infrastructure is in the cloud, you need to monitor it. This article describes the what and how of cloud monitoring.
Pretty much every business is using the cloud in some form these days. In fact, 93 percent of businesses say they use cloud services, and many anticipate investing in it more.
According to 451 Research, enterprises were expected to spend about 26% more on cloud services in 2018, which outpaces spending increases on overall IT. And it makes sense: the cloud provides unparalleled business advantages such as scalability and agility. But with increased cloud usage comes a greater need to monitor performance.
That’s where cloud monitoring comes in. You can’t afford to have delayed web application response times, under-resourced workloads, downtime, or data breaches. Cloud monitoring helps you observe response times, availability, resource consumption levels, performance, as well as predict potential issues.
What is Cloud Monitoring?
Cloud monitoring is the process of reviewing and managing the operational workflow and processes within a cloud infrastructure or asset. It’s generally implemented through automated monitoring software that gives central access and control over the cloud infrastructure.
Admins can review the operational status and health of cloud servers and components.
Concerns arise based on the type of cloud structure you have, and your strategy for using it. If you’re using a public cloud service, you tend to have limited control and visibility for managing and monitoring the infrastructure. A private cloud, which most large organizations use, provides the internal IT department more control and flexibility, with added consumption benefits.
Regardless of the type of cloud structure your company uses, monitoring is critical to performance and security.
How Cloud Monitoring Works
The cloud has many moving parts, and it’s important to ensure everything works together seamlessly to optimize performance. Cloud monitoring primarily includes functions such as:
- Website monitoring: Tracking the processes, traffic, availability and resource utilization of cloud-hosted websites
- Virtual machine monitoring: Monitoring the virtualization infrastructure and individual virtual machines
- Database monitoring: Monitoring processes, queries, availability, and consumption of cloud database resources
- Virtual network monitoring: Monitoring virtual network resources, devices, connections, and performance
- Cloud storage monitoring: Monitoring storage resources and their processes provisioned to virtual machines, services, databases, and applications
Cloud Monitoring Capabilities
Cloud monitoring makes it easier to identify patterns and discover potential security risks in the infrastructure. Some key capabilities of cloud monitoring include:
- Ability to monitor large volumes of cloud data across many distributed locations
- Gain visibility into application, user, and file behavior to identify potential attacks or compromises
- Continuous monitoring to ensure new and modified files are scanned in real time
- Auditing and reporting capabilities to manage security compliance
- Integrating monitoring tools with a range of cloud service providers
Monitoring Private, Public, and Hybrid Clouds
Cloud monitoring is easier if you operate in a private cloud for reasons we mentioned earlier (control and visibility), as you have access to the systems and software stack. Though monitoring can be more difficult in public or hybrid clouds, application performance monitoring tools (APM) give you visibility into performance behaviors.
A hybrid cloud environment presents unique challenges because data resides in both the private and public cloud. Limitations due to security and compliance can create issues for users accessing data. Admins can solve performance issues by determining what data to store in which cloud as well as what data to asynchronously update. Database synchronization can be a challenge as well, but sharding—partitioning data into smaller, faster and more easily managed parts—helps reduce issues.
Though private cloud gives you more control, you still need to monitor workloads to ensure optimum performance. Without a clear picture of workload and network performance, you can’t justify configuration or architectural changes or quantify the effectiveness of quality of service implementations or other technologies.
APM tools are helpful in private cloud environments as well, as they work hand-in-hand with existing data monitoring and management and can track performance, report results, and alert you to possible service disruptions.
Best Practices for Cloud Monitoring
Ensuring optimized performance and minimizing downtime is important to cloud monitoring. Here some ways to proactively manage the cloud and avoid common issues:
Data Security
Security is crucial in the cloud so gaining strict control over data at all endpoints helps mitigate risks. Solutions that scan, analyze, and take action on data before it leaves the network help protect against data loss. It’s also important to scan, evaluate, and classify data before it’s downloaded to the network to avoid malware and data breaches.
APIs
The cloud can have an array of performance issues from poorly designed APIs. You can avoid poor cloud API performance by using APIs that operate via objects instead of operations. This results in fewer individual API calls and less traffic. APIs with consistent designs and few data type restrictions result in better performance.
Application Workflow
An application’s response time and supporting resources are vital to understanding what’s hindering performance. Following an application’s workflow helps you identify where and when delays occur.
Allocating Cloud Servers and Storage
Overprovisioning cloud services—also known as cloud sprawl—eats up resources, availability and can impede performance. APM tools can help you find the issues, then proper policies and procedures can help mitigate sprawl and pull back resource and network use when necessary.
Monitoring the cloud requires tools that track performance, consumption, and availability while ensuring the secure transfer of data. A proper solution and management enables companies to find a balance between mitigating risks while leveraging the benefits of the cloud.
Related content
Cloud Monitoring Software & Tool
Cloud Monitoring Best Practices You Need to Adopt
Comments
How-To Blogs
WhatsUp Gold Network Monitoring Software
WhatsUp Gold makes network monitoring simple. With one unified network management dashboard, WhatsUp Gold makes it easy to monitor, alert, and report on IT infrastructure performance. IT managers can centralize physical and virtual server monitoring, application performance monitoring, bandwidth monitoring and log management to avoid downtime and fix problems fast. WhatsUp Gold allows IT to visualize and isolate network performance problems while enabling simple network discovery, mapping and configuration. Watch a demo, request a price quote or try it yourself