Furnishing Bandwidth with Network Traffic Analysis
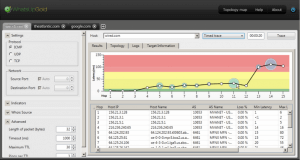
A multinational office furniture and design company came to us with a problem. Their Internet service costs were skyrocketing and they didn't know why. They had over 60 flow sources across North America and Asia. And they had little to no visibility into their network traffic and bandwidth utilization.